
gathering listing performance data
Pull Hit Counts for Listings in DABR
Pull Listing Performance Report from Back at You
Pull Listing Performance Report from CBDesk
Pull Listing Performance Report from Zillow
Pull Listing Performance Report from Realtor.com
Pull Listing Performance Report from Facebook
Pull Listing Performance Report from ShowingTime
Show clients this data in a digestible way with our Listing Performance Report.
Pull Hit Counts for Listings in DABR
After signing into Dayton Realtors at daytonrealtors.org, open the Matrix.
At the top of the screen, you will see the option called My Matrix. A dropdown menu will open, click the My Listings, to see your current listings.
On the new page, you see a dropdown that by default shows My Active Listings that shows basic listing info like status, date, price etc.
Change this dropdown to My Hit Counters, the listings will now display information related to how much attention this listing has received including:
Client Portals
Client Views
Client Favorites
Client Possibilities
Auto Emails
Prev 14 Day Views
Agent Published
Agent Rejected
Agent IDX
Agent Views
Click the link for any category you want to see more detailed information about. A graph will open based on a date range you set. This information can then be sent to a client through email or printed out for future use.
Pull Listing Performance Report from Back at You
There are several types of Reports that you can run within Back At You, to assist you and your business. To view the different types of Reports you can run, select the Reports tab on your left-hand side menu. You will see a dropdown section with the following options:
Agent, Campaign, Lead, Property, Profile, Showing Requests, and Survey and Vendor.
We’re going to focus on listing specific reports here. Click the option labeled Property. This will open your Listings Report Dashboard where you can see the different types of reports you can run along with a description of what the report includes.
Choose the report that you would like to run. The options available to you are:
Listing Supply and Demand
Requires listing and closing dates from the MLS, inventory by area and price range.Listing Supply and Demand by Price Range
Requires listing and closing dates from the MLS, inventory by area, and SELECTED price range.Listing Impressions
Reports on total listings impressions inn a specific data range.Listing Impressions by Page
Reports on where a listing or listings have appeared on the website in a specific date range. (Search results page, featured home section, etc).Listings Views
Reports on total listings viewed in a specific date range.Listings Views by Page
Reports on where a listing or listings have been viewed on the website I a specific date range.Website Referral Report
Website referral report.
After selecting your report, give your report a Name if needed, in the save as dialogue box.
Next, you can enter in the report filters (things like the Date Range of when you want this information pulled from, listing address, etc.)
Once you have your filters set, press the Run button. This will then populate the Listing Report for you to view or print.
To save a report, press the Save button on the Report Filters page. This will then populate that report and its saved filters under the Saved Reports tab along the top of the page.
Pull Listing Performance Report from CBDesk
To add a single contacts to a campaign:

After logging into Back at You, from left-hand menu navigation, select Customer Relations then select My Contacts / Leads
Search for desired contact using search box and select contact
In the contact record, on the right hand side under the Action Plan section, you will see a section called Campaigns. From this section, select Add to Campaign.
Now you will see a list of available campaigns, click the checkbox on the left side of your desired campaigns.
You can select multiple campaigns for each contact, however please keep consider the frequency of subscription and timing. We recommend adding to campaigns before or after your transaction and removing them from campaigns while you’re in a transaction. This will help to ensure that they are attentive to your emails regarding the transaction.
Newsletters are sent monthly in the last week of the month, and shows stats for prior month and year over year. Keep in mind that newsletter campaigns are labeled by region.
Heritage Holiday ecards are sent roughly every other month.
Birthday cards & anniversary card campaigns rely on adding the transaction date/birthdate to the contacts profile. Therefore they will not send if these are not completed.
Scroll to the very bottom of all action plan options, and you will see an option to Save.
You should now see the chosen campaigns in the contact’s Campaign section with a trashcan icon next to it. To remove a contact from a campaign, simply click the trash icon next to the campaign to remove.
To add a multiple contacts to a campaign:

After logging into Back at You, from left-hand menu navigation, select Customer Relations then select My Contacts / Leads
Either filter by contact type (filter option is above the first contact record) or display multiple records.
From the filtered list of contacts, either select the checkbox above all contacts to select the entire filtered list or select multiple contacts individually by choosing the checkbox next to their name.
Scroll to the very bottom, and you will see an option to + To Campaign. It will prompt you to enter emails if they are missing.
Next you should see a list of available campaigns, click the checkbox on the left side of your desired campaigns.
You can select multiple campaigns for each contact, however please keep consider the frequency of subscription and timing. We recommend adding to campaigns before or after your transaction and removing them from campaigns while you’re in a transaction. This will help to ensure that they are attentive to your emails regarding the transaction.
Newsletters are sent monthly in the last week of the month, and shows stats for prior month and year over year. Keep in mind that newsletter campaigns are labeled by region.
Heritage Holiday ecards are sent roughly every other month.
Birthday cards & anniversary card campaigns rely on adding the transaction date/birthdate to the contacts profile. Therefore they will not send if these are not completed.
Scroll to the very bottom of all campaign options, and you will see an option to Save. Once you’ve saved, all selected contacts will be added to campaign.
Pull Listing Performance Report from Zillow
Want to show your client how their listing is performing on Zillow? Check out the instruction below!
Once logged into Zillow, navigate to the upper right-hand corner and hover over the words “Agent Hub” to load the dropdown menu.
From the dropdown menu, select “Listings”, located under the “My Hub” section.
Locate the listing you are interested in running the report for and click on the address. This will pull up a popup of the listing information.
In the upper right-hand corner of the listing popup, select the three dots that say “More”. This will prompt a dropdown menu.
From the dropdown menu, select “View Owner Dashboard”. This will open a separate tab. Scroll down until you see the “Latest Activity” section. Here you will see: the last 30 days of listing traffic, the number of views and saves.
Pull Listing Performance Report from Realtor.com
Log into Realtor.com and proceed to the agent dashboard.
Navigate to the left-hand side panel and select “Listings”. This will pull up your active listings.
Within the listing row, you will see an option to send a seller report. If you wish to, you can select this option and fill in your seller’s email to send the report directly to your client OR you can select the address to open the report and view it on your own.
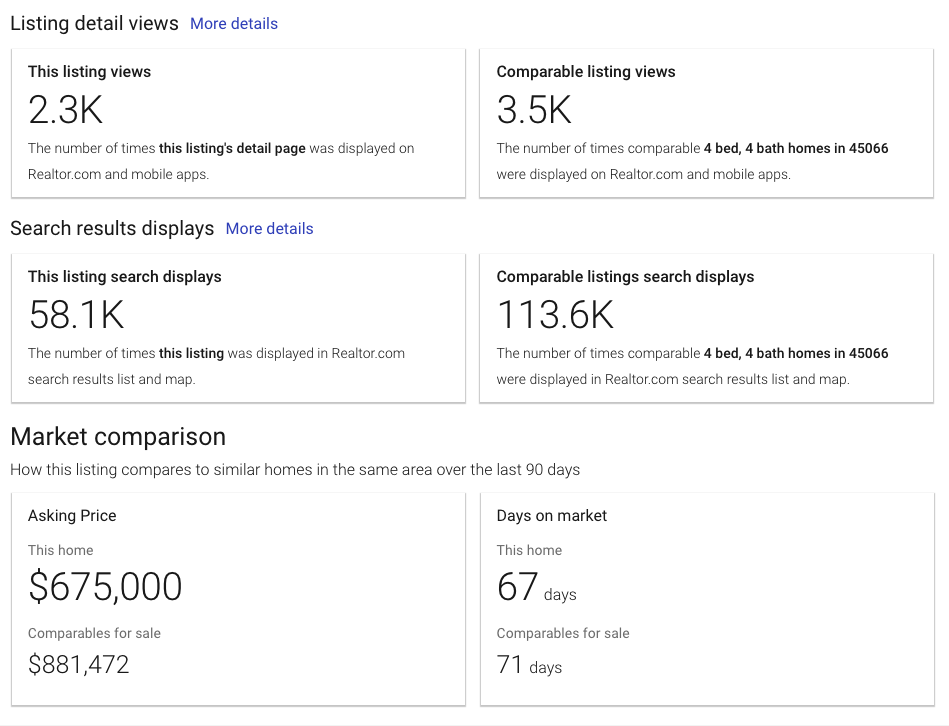
Once, you have the report open, look towards the right of the photo. Here you will find the Listings Performance, including: how many times the listing appeared in search, how many times the listing was viewed, the consumer activity (number of times a listing has been saved or shared), and the inquiries.
To view more details, scroll down and select “Listing Report”. Here you can change the time frame in which you see the listing performance, as well as view the data on comparable listings.
Pull Listing Performance Report from Facebook
Copy testimonial from Zillow, Realtor.com or other source for testimonial
Log into Back at You, from left-hand menu navigation, select Marketing under Emarketing select My Saved Content
In top-right hand corner, select Add Content
Select from the contact type dropdown - Company Template
Then use search bar to narrow further by searching “Testimonial”, once found click Select next to the appropriate template (Social_testimonial_template_heritage)
Click on the testimonial text box and delete existing text and right-click and click paste and then click OK
Next update the reviewer with the name or something descriptive but generic - “Sold Single Family Home in Kettering” and then click OK
Once you’ve completed your edits, in top-right hand corner, click Save & Share
Another menu will appear, under the Share With section select the desired social media channel
Pull Listing Performance Report from ShowingTime
Pulling Activity on Comparables
Log into ShowingTime and navigate to the left-hand panel. Select “Reports”.
Select “Activity on Comparables Report”. Input the parameters of your listing, including: price range, number of beds, cities, zip codes, property type, subdivision, school districts, county, and the dates for which you would like to see the number of showings scheduled.
Click “Submit” and ShowingTime will pull up every showing that matches your search criteria. These will be organized by address and you can easily see how many showings properties similar to your listing have received in a given amount of time.
Pulling Target Market Analysis
Log into ShowingTime and navigate to the left-hand panel. Select “Reports”.
Select “Target Market Analysis”. Input the parameters of your listing, including: price range, number of beds, cities, zip codes, property type, subdivision, school districts, county, and the dates for which you would like to see the number of showings scheduled.
Click “Submit” and ShowingTime will pull up the total number of showings in the criteria you specified, broken down by price range. These not only show the weekly average number of showings in each price range per week, but show the average number of showings per listing in the given price range. This data can help your seller understand how their listing compares to others, as well as give you bargaining power for negotiating a price reduction.